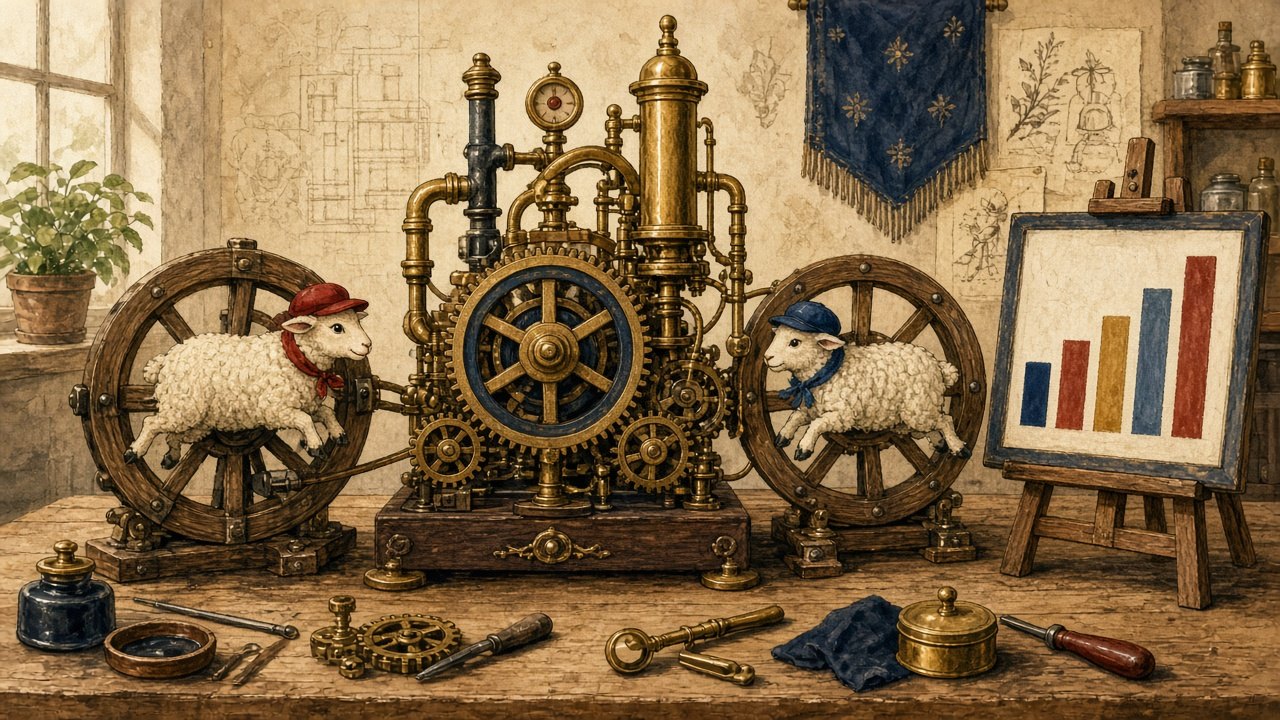
For centuries, inventors chased the perpetual motion machine, a device that would run forever without new fuel. Physicists declared it impossible. Physicists, it turns out, never covered American race debates.
Our team has spent a season observing the first working model. It consists of a single chart, any chart, showing that two groups of Americans have different average outcomes on something. The machine runs on that chart. It has been running for decades. It has never needed a second chart, and it has never produced a conclusion, which is how you know it is working.
How the machine works
The mechanism is elegant. The chart is placed in the center of the room. A member of one tribe looks at it and sees proof of unfair treatment. A member of the other tribe looks at the identical chart and sees proof of choices, culture or circumstance. Each then shares it, with a caption, to an audience that agrees with the caption.
“It has never needed a second chart, and it has never produced a conclusion, which is how you know it is working.”
The beauty is that neither side needs to read past the chart. The methods section, the footnotes about what was and was not measured, the paragraph where the authors list the limits of their own data: none of these are load-bearing. The machine runs on the picture.
The smart ones build the gears
As usual, our most sophisticated specimens did the most work.
We interviewed two credentialed researchers, both fictional, from two think tanks that each describe themselves as independent. Dr. Cherry Picker explained, with real fluency, why the chart could only mean one thing. Dr. Stan Dardeviation explained, with equal fluency, why it could only mean the opposite. Each had a decade of citations. Each, asked whether the other’s explanation could account for even part of the gap, gave the same answer: “That’s not a serious position.”
Neither of them engaged the other’s argument. They did something more efficient. They disqualified the person making it. One side’s favorite move was you don’t get to have an opinion on this. The other side’s favorite move was who’s paying you to say that? Both moves end the argument before anyone touches the evidence, which is the point.
“Never touch the evidence,” an anonymous debate coach told us. “Evidence is where you can lose.”
Sequential monologues
We then observed the machine in its natural habitat: a cable panel called “Talking Past Each Other Tonight,” which is fictional, but only barely.
Two guests were booked, one from each tribe. Each was given ninety seconds. Each spent the ninety seconds restating the position they had arrived with. Neither asked the other a question. When the host attempted a follow-up, both guests answered a different question, the one they had prepared for. The segment was considered a success by everyone involved, because it produced two viral clips, one for each audience, each showing its own guest “destroying” the other.
Nobody was persuaded, and nobody was supposed to be. A debate in which no one listens is not a debate. It is two monologues sharing a microphone, and it rates beautifully.
Who keeps the lights on
A machine that runs forever is worth a great deal to the people who own it.
Think tanks raise money on the chart. Networks book the chart. Activists in both tribes build careers interpreting the chart. Each side’s outrage at the other side’s reading is renewable: it is never used up by being burned. If the question were ever narrowed down, or partly answered, or answered with the boring phrase “several causes, in proportions we are still measuring,” the machine would slow, and a lot of people would need new work.
The chart in your hand
We should be honest with our readers, who are by now enjoying the spectacle of two experts talking past each other. Which of them did you agree with before we described their argument? We left it blank on purpose. You filled it in anyway.
The questions underneath the chart are real and they matter enormously, to real people with real lives. That is exactly why they deserve better than a machine. A serious question can survive the sentence “more than one thing could be true here, and here’s how we’d find out.” A machine cannot.
Powering down
At the end of the season we tried a small experiment. We gave both researchers the same chart and asked a single question: “What would this chart look like if you were wrong?”
Dr. Picker took a long time. So did Dr. Dardeviation. Each eventually described a version of the chart that would change their mind, and the conversation that followed was slower, quieter and considerably less clippable. For about twenty minutes, the wheels stopped turning, and two people looked at the same piece of paper together. We have no footage of it. Nobody wanted any.
Satire This article is a work of comedy. Dr. Fieldnote, Inés Telefoto, Dr. Cherry Picker, Dr. Stan Dardeviation, “Talking Past Each Other Tonight,” the two think tanks and the Desk of Persuasion are fictional. The chart in this story is deliberately left blank; no real statistic is cited and the piece takes no side on the causes of any disparity. The illustration is AI-generated and shows no real person. National Sarcastic is not affiliated with National Geographic.